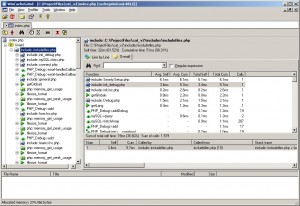
One of the coolest features of Xdebug is the Profiler. By enabling the Profiler you can generate what are essentially full traces about your php scripts that are invaluable in fine tuning your code and isolating problem areas effectively.
According to the official page on the xdebug Profiler:
Xdebug's built-in profiler allows you to find bottlenecks in your script and visualize those with an external tool such as KCacheGrind or WinCacheGrind. Xdebug's Profiler is a powerful tool that gives you the ability to analyze your PHP code and determine bottlenecks or generally see which parts of your code are slow and could use a speed boost.
There's some serious information in these little files too. By importing the debug files into a tool called WinCacheGrind you can view the files in a format that won't make you stick a knife in your eyes.
Here's a small example of the exported data:
version: 0.9.6
cmd: C:ProjectFilescat_v2index.php
part: 1

events: Time

fl=php:internal
fn=php::define
3 7

fl=php:internal
fn=php::get_include_path
4 6

fl=php:internal
fn=php::set_include_path
4 5
To get started first make sure you have Xdebug 2.0 installed. To check, execute the below in a dos prompt:
php -v
You should see something like the below:
PHP 5.2.6 (cli) (built: May  2 2008 18:02:07)
Copyright (c) 1997-2008 The PHP Group
Zend Engine v2.2.0, Copyright (c) 1998-2008 Zend Technologies
with Xdebug v2.0.3, Copyright (c) 2002-2007, by Derick Rethans
If not, you'll need to download and install Xdebug.
If you do have Xdebug, modify your php.ini to include the below after the Xdebug init call:
xdebug.profiler_enable = 1
xdebug.profiler_output_dir = "C:/path/to/profiler/storage"
Once you've configured php you might need to restart your server depending on how php is implemented. Either way, to generate a profile output just execute a script; the output should be written to the directory you set in the xdebug.profiler_output_dir.
All that's left is to open the profile output in WinCacheGrind.
Notes:
The profilers seems to only record data if the script is executed from the command line.
Download WinCacheGrind


