The Google Visualization API is a JavaScript API for creating those fancy graphs and charts Google displays in all their cool toys like Google Analytics. There's just an obnoxious amount of chart types available in the Visualization API Gallery that include code samples along with every example. There's also the incredible Google Ajax API Playground which lets you play with the API and see real-time output.
According the official website:
The Google Visualization API lets you access multiple sources of structured data that you can display, choosing from a large selection of visualizations. Google Visualization API enables you to expose your own data, stored on any data-store that is connected to the web, as a Visualization compliant datasource. Thus you can create reports and dashboards as well as analyze and display your data through the wealth of available visualization applications. The Google Visualization API also provides a platform that can be used to create, share and reuse visualizations written by the developer community at large.
I have no real interest in publishing public widgets and I've only used the API by generating the data declarations; so far anyway. That's actually what's so compelling about the API; since it's JavaScript based the API can be used with any server side language.
I'm mostly interested in using the charts and graphs for displaying data from a database on a website so that's all this article is going to focus on.
One more thing to keep in mind; the API is just JavaScript. There's nothing too fancy or random being done so even though the below may look complicated don't forget; IT'S JUST JAVASCRIPT.
Examples
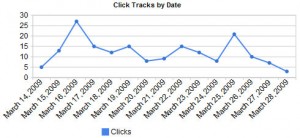
Line Chart
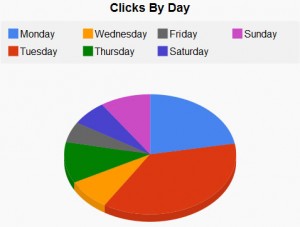
Pie Chart


