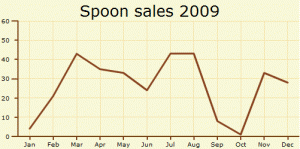
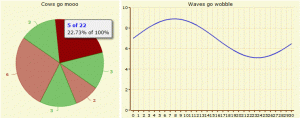
Everyone likes the pretty. The pretty makes people feel nice and adds a sense of peace and comfort. The pretty is good and brings joy to small children.
We all want our data to be pretty. Tables of numbers just aren't fun for anyone. Except programmers; we don't give a shit.
Oddly though, PHP hasn't had many options for pretty charts and graphs. Sure, we have JpGraph but it's a little cumbersome and... well ugly's a good word for it. Recently I heard about pChart, which I'll be writing about another time, but aside from the cosmetic upgrade it doesn't seem too different than JpGraph.
I've already gone into some detail about the Google Visualization API, which is a pretty good JavaScript implementation for creating charts and graphs, but that too is a little challenging to implement.
I've recently become enthralled with Open Flash Charts (OFC) though. OFC is an open source flash charting system that uses external data-files to keep the program language agnostic. You can use pretty much any web programming language, so long as it can output strings, and you're in business. In fact, there are libraries for a slew of languages including .NET, perl, python and ruby packaged right along with the download.
OFC was started because, I shit you not, the initial developer was burned by a vendor when looking for support on a PAID product. So he did what any programmer would do; wrote an open source version to help put that crappy company in hot water. Kudos 😊
It's a pretty slick setup though. OFC works by embedding a swf in a webpage and then setting a flashvar to point to a datafile on the server. Simple. Well... sort of...
There are 2 different versions to use; each given the very original titles v1 and v2 respectively. Near as I can tell the latest version uses JSON as the data format while version 1 uses something a little more... generic. The problem is that version 2 has only a couple examples and version 1 has a ton so while I like to use the latest and greatest I have to stick with version 1 for now. That's what this article is going to focus on.
First, to get started, be sure to download the files from SourceForge. The download for version 1 was a little hard to find so, in the interest of helping others, I'm providing a direct link to download Open Flash Charts version 1.9.7. The download includes the swf, which you'll obviously need to embed in your page, and the wrapper code which is provided in quite a few different lanuages (if you don't do php).
Using the wrapper code makes creating the really complicated strings for the swf to absorb. Sure, you could do it by hand, but why the fuck would you?
The official site acutally has some really good examples of how to work with the code, so I won't go into that too much here. Suffice it to say it's pretty easy to create charts and graphs. The hardest part is getting used to the process of instantiating the code in the template (HTML) and then creating a stand alone script that gets hit by the swf for the data.
The HTML portion of the code is the simplest; you include the library (if it hasn't been done already) and call a function like so:
<?php
include_once 'ofc-library/open_flash_chart_object.php';
open_flash_chart_object( $width, $height, $url, $use_swfobject=true, $base='' );
?>
The only two that should be confusing is $base and $url.
$base is useful if you don't store the swf inside the site's root directory; just set $base to the path, from your sites document root and you're good.
For example:
<?php
//BAD
//$base = $_SERVER.'/path/to/open-flash-chart.swf';

//GOOD
$base = '/path/to/open-flash-chart.swf';
?>
$url is the full URL to the sister script to provide the options and data to the swf. It's important to keep in mind that all the options for the swf are provided by this script. Seriously, all the options. What type of graph to generate, the data for the graph, the style for the graph, everything is generated on the server. The swf just interprets that data and draws accordingly.
The code for the sister script is a little more complicated but pretty straight forward once you understand it. NOTE, this was taken line for line from the official site:
<?php

// generate some random data:

srand((double)microtime()*1000000);

$max = 50;

$data = array();

for( $i=0; $i<12; $i++ )

{

  $data
OFC is definitely worth a look for the pretty.

