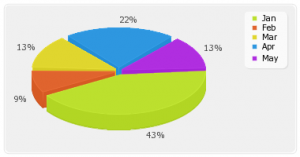
In my never ending quest to find a replacement for JpGraph I've covered charts built using JavaScript with the Google Visualization API and charts done with SWFs using Open Flash Charts (OFS). If you're building web apps it's easy to just stop there and consider yourself covered. I certainly thought so; until my conscience spoke up that is.
The thought them comes creaping into my head, "Um... What about the JavaScript? How do you think those pretty charts and graphs will degrade?".
Shit.
Not to take anything away from either of those programs; they're very fun to work with and, relatively, easy to use. It's just that they're both rendered using JavaScript which is well and good provided your user has JavaScript enabled (and Flash too for OFS). It'd be a nice addition to provide an alternative when using either one of the previous programs.
This is where pChart comes in:
pChart is a PHP class oriented framework designed to create aliased charts. Most of todays chart libraries have a cost, our project is intended to be free. Data can be retrieved from SQL queries, CSV files, or manually provided. This project is still under development and new features or fix are made every week.
Focus has been put on rendering quality introducing an aliasing algorithm to draw eye candy graphics. Rendering speed has been dramatically enhanced since the first version, we'll still continue optimising the code!
Implementation is pretty easy too:
// Standard inclusions
include("pChart/pData.class");
include("pChart/pChart.class");

// Dataset definition
$DataSet = new pData;
$DataSet->AddPoint(array(1,4,3,2,3,3,2,1,0,7,4,3,2,3,3,5,1,0,7));
$DataSet->AddSerie();
$DataSet->SetSerieName("Sample data","Serie1");

// Initialise the graph
$Test = new pChart(700,230);
$Test->setFontProperties("Fonts/tahoma.ttf",10);
$Test->setGraphArea(40,30,680,200);
$Test->drawGraphArea(252,252,252);
$Test->drawScale($DataSet->GetData(),$DataSet->GetDataDescription(),SCALE_NORMAL,150,150,150,TRUE,0,2);
$Test->drawGrid(4,TRUE,230,230,230,255);

// Draw the line graph
$Test->drawLineGraph($DataSet->GetData(),$DataSet->GetDataDescription());
$Test->drawPlotGraph($DataSet->GetData(),$DataSet->GetDataDescription(),3,2,255,255,255);

// Finish the graph
$Test->setFontProperties("Fonts/tahoma.ttf",8);
$Test->drawLegend(45,35,$DataSet->GetDataDescription(),255,255,255);
$Test->setFontProperties("Fonts/tahoma.ttf",10);
$Test->drawTitle(60,22,"My pretty graph",50,50,50,585);
$Test->Render("Naked.png");
?>
The above code produces something similar to:
One really cool addition the developers added was a little cmd script, buildAll.cmd, to automate the build of all the Example scripts on Windows machines. Just double click that and you'll have all the graph images generated automatically.
It is recommended by the developers that caching is implemented but I haven't really found the need for it yet.
A good idea, and one I'm going to be implementing, is to use charts and graphs created with OFC and create static image graphs for the noscript tags using pChart. Definitely a lot of work but it'll add a bit of shiny to my programs. Yours too I think.


