The Linux command "top" is one of the most used and powerful jewels in a developers pocket.
In most Unix-like operating systems, the top command is a system monitor tool which produces a frequently-updated list of processes. By default, the processes are ordered by percentage of CPU usage, with only the "top" CPU consumers shown. The top command shows how much processing power and memory are being used, as well as other information about the running processes. Some versions of top allow extensive customization of the display, such as choice of columns or sorting method.
The top command is useful for system administrators, as it shows which users and processes are consuming the most system resources at any given time.
The great thing about "top" also highlights one of it's weaknesses; it's focused on CPU, memory (RAM) and time. Top is wonderful if you want to know how much performance your program is using but if you want to know how much the individual components are using you're out of luck.
Enter mtop.
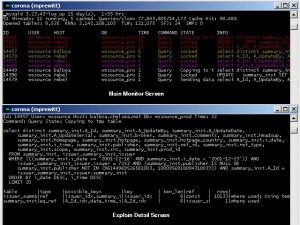
mtop (MySQL top) monitors a MySQL server showing the queries which are taking the most amount of time to complete. Features include 'zooming' in on a process to show the complete query, 'explaining' the query optimizer information for a query and 'killing' queries. In addition, server performance statistics, configuration information, and tuning tips are provide
mtop is a pretty useful program; it really helps in finding out the trouble spots in queries. There one obstacle to consider before diving into though; mtop is written in PERL so there are a couple module dependancies (Curses, DBI, DBD::mysql, Getopt::Long and Net::Domain
Still, I didn't run into any issues installing the program and, so far anyway, mtop is a nice addition to my tool box.

